17 Fit Food calories Grains, legumes and flour
Quinoa calories and nutrition facts
Per 100 g: 368 kcal — 14.1 g protein, 6.1 g fat and 64.2 g carbs.
Quinoa is the seed of an Andean plant, cooked like rice in about 15 minutes and usually rinsed first to wash off its bitter coating. These numbers are for the dry seed, so weigh it before cooking – a 60 g portion swells to roughly three times its weight in the pan. It’s rich in manganese, folate and phosphorus.
- Source of protein
- High in fibre
- Salt-free
- High in manganese
- Protein 15%
- Fat 15%
- Carbs 70%
In everyday portions
- Typical serving · 60 g 221 kcal
- 100 kcal is 27 g this much of it gives 100 kcal
- 20 g of protein is 140 g this much to eat for 20 g of protein
- Energy density Medium 3.7 kcal per gram: the lower it is, the more food you get for the same calories
Nutrition per 100 g
The percentage is the share of an adult’s daily reference intake set by the EU (Regulation 1169/2011).
Energy and macros
- Energy 368 kcal 18%
- Protein 14.1 g 28%
- Fat 6.1 g 9%
- Carbs including fibre 64.2 g 25%
- Fibre 7 g
- Salt 0.01 g <1%
Where the calories come from
- Protein 15%
- Fat 15%
- Carbs 70%
Protein and carbs give 4 kcal a gram, fat 9. “Other” is fibre, alcohol and organic acids.
Vitamins
- Vitamin A 1 µg <1%
- Vitamin D 0 µg 0%
- Vitamin E 2.4 mg 20%
- Vitamin K 0 µg 0%
- Vitamin C no data
- Vitamin B1 (thiamin) 0.36 mg 33%
- Vitamin B2 (riboflavin) 0.318 mg 23%
- Vitamin B3 (niacin) 1.5 mg 10%
- Vitamin B5 (pantothenic acid) 0.772 mg 13%
- Vitamin B6 0.487 mg 35%
- Folate (B9) 184 µg 92%
- Vitamin B12 0 µg 0%
- Choline 70.2 mg
Minerals
- Potassium 563 mg 28%
- Calcium 47 mg 6%
- Phosphorus 457 mg 65%
- Magnesium 197 mg 53%
- Iron 4.6 mg 33%
- Zinc 3.1 mg 31%
- Copper 0.59 mg 59%
- Manganese 2 mg 102%
- Selenium 8.5 µg 15%
- Iodine no data
- Sodium 5 mg <1%
EU criteria for nutrition claims
Which of them 100 g of this food meets under Regulation (EC) 1924/2006.
- Source of protein
- High in fibre
- Salt-free
- High in manganese
- High in folate
- High in phosphorus
- High in copper
- High in magnesium
- High in vitamin B6
- High in vitamin B1
- High in iron
- High in zinc
- Source of potassium
- Source of vitamin B2
- Source of vitamin E
- Source of selenium
Grains, legumes and flour
Among grains, legumes and flours
The category in the 17 Fit catalog: 157 foods. Compared per 100 g.
- 80% More calories than 80% of grains, legumes and flours.
- 83% More protein than 83% of grains, legumes and flours.
- 80% More manganese than 80% of grains, legumes and flours.
- 90% More folate than 90% of grains, legumes and flours.
- 94% More phosphorus than 94% of grains, legumes and flours.
Similar in composition
The foods with the nearest calories and macros.
- Oats 379 kcal
- Egg noodles 384 kcal
- Muesli 370 kcal
- Semolina 360 kcal
- Wheat flour 364 kcal
- Bulgur 342 kcal
17 Fit
Count calories without scales or tables
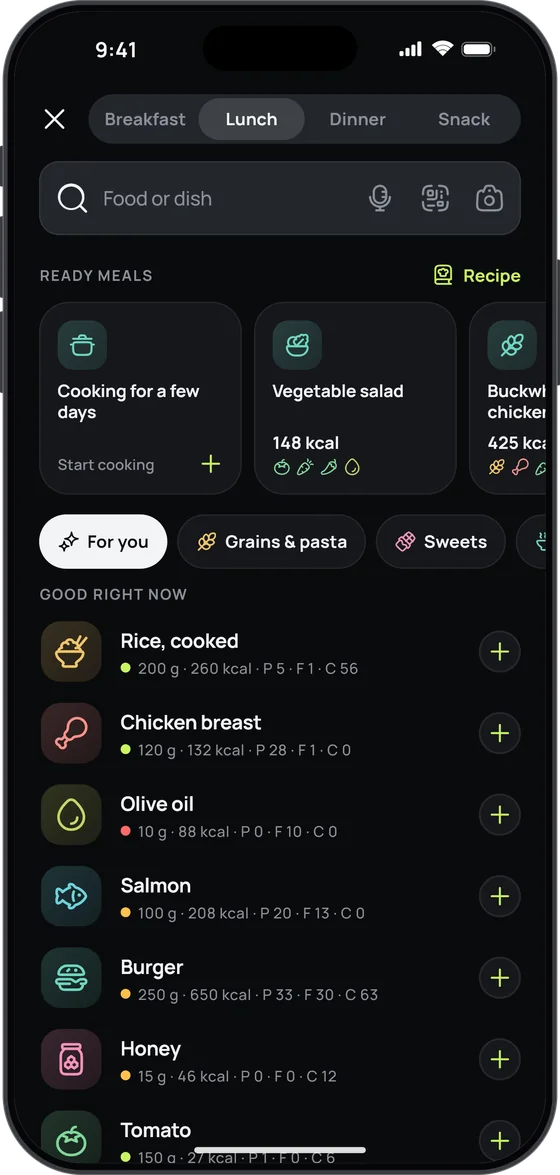
Snap your plate or just say what you ate — 17 Fit recognises the dishes, estimates the grams and counts the calories, macros, vitamins and minerals.
- Photo, voice or a search among 2,557 foods and dishes
- A plan that adjusts to your weight every week
- Free food diary, no sign-up and no ads

Where these numbers come from
Calories and macros: 17 Fit’s reference values, the same as in the app.
Vitamins and minerals: USDA FoodData Central (SR Legacy, USA).
Carbs are given including fibre.