17 Fit Food calories Bread and pastries
French toast calories and nutrition facts
Per 100 g: 273 kcal — 10.4 g protein, 11.4 g fat and 31.1 g carbs.
French toast is bread soaked in egg and milk and fried in butter, a classic brunch dish served with maple syrup, berries or bacon. One slice of about 60 g has around 165 kcal, and thick-cut brioche or challah versions are richer. Maple syrup is often the biggest addition, and a generous pour can rival the toast itself.
- Source of protein
- High in folate
- High in selenium
- Source of vitamin D
- Protein 15%
- Fat 38%
- Carbs 46%
In everyday portions
- 1 piece ≈ 60 g 164 kcal
- Typical serving · 120 g 328 kcal
- 100 kcal is 37 g this much of it gives 100 kcal
- 20 g of protein is 195 g this much to eat for 20 g of protein
- Energy density Medium 2.7 kcal per gram: the lower it is, the more food you get for the same calories
Nutrition per 100 g
The percentage is the share of an adult’s daily reference intake set by the EU (Regulation 1169/2011).
Energy and macros
- Energy 273 kcal 14%
- Protein 10.4 g 21%
- Fat 11.4 g 16%
- Carbs available, without fibre 31.1 g 12%
- Fibre 1.2 g
- Salt 0.76 g 13%
Where the calories come from
- Protein 15%
- Fat 38%
- Carbs 46%
Protein and carbs give 4 kcal a gram, fat 9. “Other” is fibre, alcohol and organic acids.
Vitamins
- Vitamin A 106 µg 13%
- Vitamin D 1.2 µg 24%
- Vitamin E 1.3 mg 11%
- Vitamin K 4.5 µg 6%
- Vitamin C 0 mg 0%
- Vitamin B1 thiamin 0.236 mg 21%
- Vitamin B2 riboflavin 0.306 mg 22%
- Vitamin B3 niacin 2.4 mg 15%
- Vitamin B5 pantothenic acid 0.74 mg 12%
- Vitamin B6 0.112 mg 8%
- Folate B9 95 µg 48%
- Vitamin B12 0.41 µg 16%
- Choline 122 mg
Minerals
- Potassium 135 mg 7%
- Calcium 143 mg 18%
- Phosphorus 148 mg 21%
- Magnesium 20 mg 5%
- Iron 2.4 mg 17%
- Zinc 1 mg 10%
- Copper 0.063 mg 6%
- Manganese 0.22 mg 11%
- Selenium 24.9 µg 45%
- Iodine 10.2 µg 7%
- Sodium 302 mg 13%
EU criteria for nutrition claims
Which of them 100 g of this food meets under Regulation (EC) 1924/2006.
- Source of protein
- High in folate
- High in selenium
- Source of vitamin D
- Source of vitamin B2
- Source of vitamin B1
- Source of phosphorus
- Source of calcium
- Source of iron
- Source of vitamin B12
Bread and pastries
Among breads and pastries
The category in the 17 Fit catalog: 128 foods. Compared per 100 g.
- 64% Fewer calories than 64% of breads and pastries.
- 83% More protein than 83% of breads and pastries.
- 83% More folate than 83% of breads and pastries.
- 90% More selenium than 90% of breads and pastries.
- 96% More vitamin D than 96% of breads and pastries.
Similar in composition
The foods with the nearest calories and macros.
- Cornbread 287 kcal
- Cornish pasty 278 kcal
- Naan 311 kcal
- Tortillas 297 kcal
- Whole wheat bread 247 kcal
- Yorkshire puddings 197 kcal
17 Fit
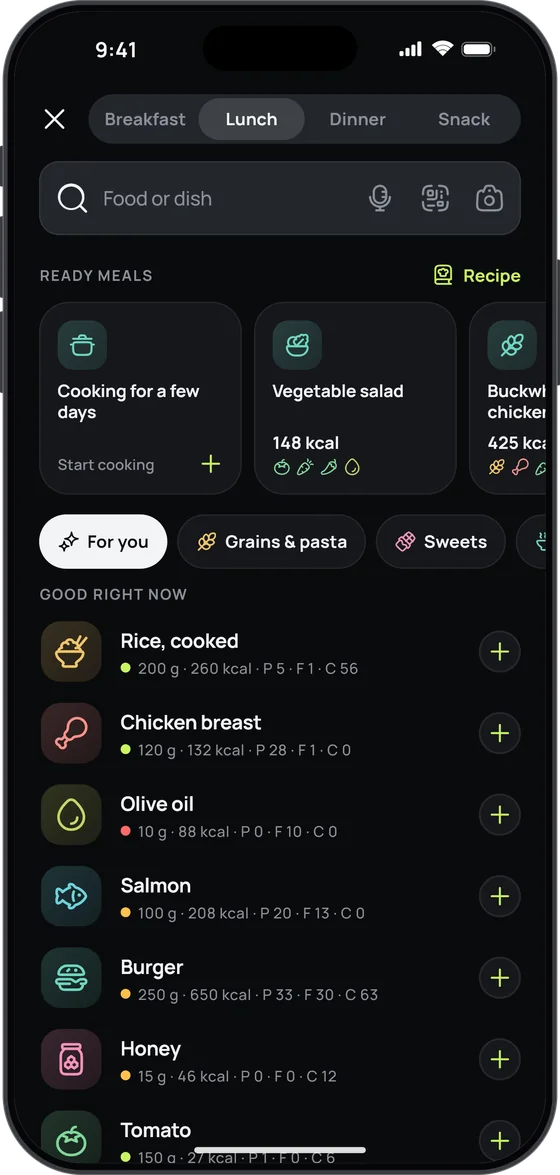
Count calories without scales or tables
Snap your plate or just say what you ate — 17 Fit recognises the dishes, estimates the grams and counts the calories, macros, vitamins and minerals.
- Photo, voice or a search among 2,557 foods and dishes
- A plan that adjusts to your weight every week
- Free food diary, no sign-up and no ads

Where these numbers come from
USDA FoodData Central (FNDDS, USA), code 2708335.
The vitamins and minerals it lacked come from ANSES-CIQUAL (France).
Carbs are available carbohydrates, without fibre, as on EU labels.