17 Fit Food calories Bread and pastries
Naan calories and nutrition facts
Per 100 g: 311 kcal — 11.1 g protein, 7.3 g fat and 45 g carbs.
Naan is the soft, blistered flatbread baked against the wall of a tandoor oven and served with curries for tearing and scooping. One piece of about 90 g has around 280 kcal, but restaurant naans are often much larger. Garlic and butter naan is brushed with ghee or butter after baking, and peshwari naan is filled with coconut, almonds and raisins, so both come in higher.
- Source of protein
- Source of fibre
- Source of phosphorus
- Source of vitamin B3
- Protein 14%
- Fat 21%
- Carbs 58%
- Other 7%
In everyday portions
- 1 piece ≈ 90 g 280 kcal
- 100 kcal is 32 g this much of it gives 100 kcal
- 20 g of protein is 180 g this much to eat for 20 g of protein
- Energy density Medium 3.1 kcal per gram: the lower it is, the more food you get for the same calories
Nutrition per 100 g
The percentage is the share of an adult’s daily reference intake set by the EU (Regulation 1169/2011).
Energy and macros
- Energy 311 kcal 16%
- Protein 11.1 g 22%
- Fat 7.3 g 10%
- Carbs available, without fibre 45 g 17%
- Fibre 5.2 g
- Salt 1.3 g 21%
Where the calories come from
- Protein 14%
- Fat 21%
- Carbs 58%
- Other 7%
Protein and carbs give 4 kcal a gram, fat 9. “Other” is fibre, alcohol and organic acids.
Vitamins
- Vitamin A 2 µg <1%
- Vitamin D 0 µg 0%
- Vitamin E 1.4 mg 12%
- Vitamin K 3.6 µg 5%
- Vitamin C 0 mg 0%
- Vitamin B1 thiamin 0.153 mg 14%
- Vitamin B2 riboflavin 0.196 mg 14%
- Vitamin B3 niacin 3.9 mg 24%
- Vitamin B5 pantothenic acid no data
- Vitamin B6 0.139 mg 10%
- Folate B9 15 µg 8%
- Vitamin B12 0 µg 0%
- Choline 11 mg
Minerals
- Potassium 201 mg 10%
- Calcium 64 mg 8%
- Phosphorus 204 mg 29%
- Magnesium 74 mg 20%
- Iron 1.9 mg 13%
- Zinc 1.4 mg 14%
- Copper 0.172 mg 17%
- Manganese no data
- Selenium 12.4 µg 23%
- Iodine no data
- Sodium 508 mg 21%
EU criteria for nutrition claims
Which of them 100 g of this food meets under Regulation (EC) 1924/2006.
- Source of protein
- Source of fibre
- Source of phosphorus
- Source of vitamin B3
- Source of selenium
- Source of magnesium
- Source of copper
Bread and pastries
Among breads and pastries
The category in the 17 Fit catalog: 128 foods. Compared per 100 g.
- 85% More protein than 85% of breads and pastries.
- 83% More fibre than 83% of breads and pastries.
- 86% More phosphorus than 86% of breads and pastries.
- 89% More vitamin B3 than 89% of breads and pastries.
- 93% More magnesium than 93% of breads and pastries.
Similar in composition
The foods with the nearest calories and macros.
- Tortillas 297 kcal
- Bread rolls 293 kcal
- Soft pretzels 330 kcal
- Hot cross buns 312 kcal
- Cornbread 287 kcal
- White bread 265 kcal
17 Fit
Count calories without scales or tables
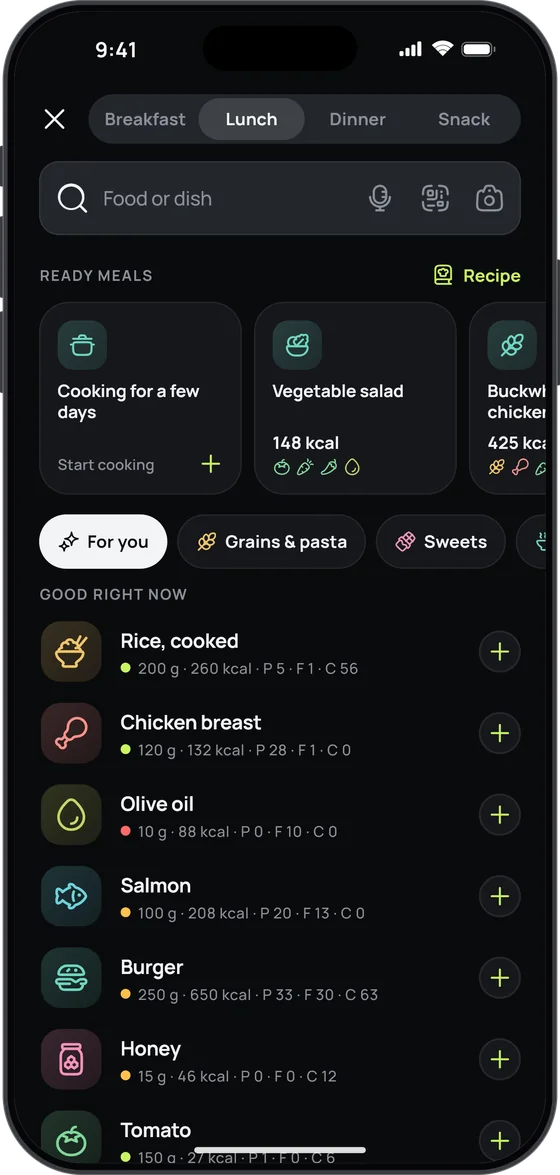
Snap your plate or just say what you ate — 17 Fit recognises the dishes, estimates the grams and counts the calories, macros, vitamins and minerals.
- Photo, voice or a search among 2,557 foods and dishes
- A plan that adjusts to your weight every week
- Free food diary, no sign-up and no ads

Where these numbers come from
USDA FoodData Central (FNDDS, USA), code 2707613.
Carbs are available carbohydrates, without fibre, as on EU labels.