17 Fit Food calories Sweets and desserts
Candy bars calories and nutrition facts
Per 100 g: 523 kcal — 6.1 g protein, 28.1 g fat and 60.5 g carbs.
Candy bars, or chocolate bars in Britain, combine chocolate with cookie, wafer, caramel, nougat or coconut, and whatever the filling they land at roughly 500 kcal per 100 g. Bars range from about 20 g to 50 g or more, so the weight on the wrapper is the number to log. Per piece, wafer bars tend to be the lightest and caramel‑and‑nougat bars the heaviest.
- High in phosphorus
- High in calcium
- High in vitamin E
- Source of copper
- Protein 5%
- Fat 49%
- Carbs 47%
In everyday portions
- 1 piece ≈ 25 g 131 kcal
- Typical serving · 50 g 262 kcal
- 100 kcal is 19 g this much of it gives 100 kcal
- 20 g of protein is 325 g this much to eat for 20 g of protein
- Energy density High 5.2 kcal per gram: the lower it is, the more food you get for the same calories
All the variants
How the calories and macros change with the variety and the cooking. Values per 100 g.
| Variant | Kcal | Protein | Fat | Carbs |
|---|---|---|---|---|
| Chocolate and cookie | 523 | 6.1 | 28.1 | 60.5 |
| Caramel and nougat | 496 | 3.7 | 24.1 | 66.4 |
| Chocolate wafer | 511 | 6.5 | 29.4 | 55.1 |
| Coconut | 475 | 3.9 | 23.8 | 60.2 |
Nutrition per 100 g
The percentage is the share of an adult’s daily reference intake set by the EU (Regulation 1169/2011).
Chocolate and cookie
Energy and macros
- Energy 523 kcal 26%
- Protein 6.1 g 12%
- Fat 28.1 g 40%
- Carbs available, without fibre 60.5 g 23%
- Fibre 1.9 g
- Salt 0.39 g 6%
Where the calories come from
- Protein 5%
- Fat 49%
- Carbs 47%
Protein and carbs give 4 kcal a gram, fat 9. “Other” is fibre, alcohol and organic acids.
Vitamins
- Vitamin A no data
- Vitamin D 0.058 µg 1%
- Vitamin E 3.7 mg 31%
- Vitamin K no data
- Vitamin C 0.62 mg <1%
- Vitamin B1 thiamin 0.089 mg 8%
- Vitamin B2 riboflavin 0.2 mg 14%
- Vitamin B3 niacin 0.97 mg 6%
- Vitamin B5 pantothenic acid 0.46 mg 8%
- Vitamin B6 0.09 mg 6%
- Folate B9 2.3 µg 1%
- Vitamin B12 0.32 µg 13%
- Choline no data
Minerals
- Potassium 356 mg 18%
- Calcium 263 mg 33%
- Phosphorus 234 mg 33%
- Magnesium 45 mg 12%
- Iron 1.8 mg 13%
- Zinc 0.63 mg 6%
- Copper 0.18 mg 18%
- Manganese 0.3 mg 15%
- Selenium 5 µg 9%
- Iodine 5.8 µg 4%
- Sodium 155 mg 6%
EU criteria for nutrition claims
Which of them 100 g of this food meets under Regulation (EC) 1924/2006.
- High in phosphorus
- High in calcium
- High in vitamin E
- Source of copper
- Source of potassium
- Source of manganese
Caramel and nougat
Energy and macros
- Energy 496 kcal 25%
- Protein 3.7 g 7%
- Fat 24.1 g 34%
- Carbs available, without fibre 66.4 g 26%
- Fibre 0.6 g
- Salt 0.5 g 8%
Where the calories come from
- Protein 3%
- Fat 44%
- Carbs 53%
Protein and carbs give 4 kcal a gram, fat 9. “Other” is fibre, alcohol and organic acids.
Vitamins
- Vitamin A no data
- Vitamin D 0.046 µg <1%
- Vitamin E 11.2 mg 93%
- Vitamin K no data
- Vitamin C 0.54 mg <1%
- Vitamin B1 thiamin 0.049 mg 4%
- Vitamin B2 riboflavin 0.22 mg 16%
- Vitamin B3 niacin 0.14 mg <1%
- Vitamin B5 pantothenic acid 0.31 mg 5%
- Vitamin B6 0.037 mg 3%
- Folate B9 0.47 µg <1%
- Vitamin B12 0.33 µg 13%
- Choline no data
Minerals
- Potassium 42 mg 2%
- Calcium 99.8 mg 12%
- Phosphorus 155 mg 22%
- Magnesium 50.9 mg 14%
- Iron 3.6 mg 26%
- Zinc 0.56 mg 6%
- Copper 0.15 mg 15%
- Manganese 0.13 mg 6%
- Selenium 1.1 µg 2%
- Iodine 15.6 µg 10%
- Sodium 200 mg 8%
EU criteria for nutrition claims
Which of them 100 g of this food meets under Regulation (EC) 1924/2006.
- High in vitamin E
- Source of iron
- Source of phosphorus
- Source of vitamin B2
- Source of copper
Chocolate wafer
Energy and macros
- Energy 511 kcal 26%
- Protein 6.5 g 13%
- Fat 29.4 g 42%
- Carbs available, without fibre 55.1 g 21%
- Fibre 4.9 g
- Salt 0.32 g 5%
Where the calories come from
- Protein 5%
- Fat 52%
- Carbs 43%
Protein and carbs give 4 kcal a gram, fat 9. “Other” is fibre, alcohol and organic acids.
Vitamins
- Vitamin A no data
- Vitamin D no data
- Vitamin E no data
- Vitamin K no data
- Vitamin C 0.5 mg <1%
- Vitamin B1 thiamin no data
- Vitamin B2 riboflavin no data
- Vitamin B3 niacin no data
- Vitamin B5 pantothenic acid no data
- Vitamin B6 no data
- Folate B9 no data
- Vitamin B12 no data
- Choline no data
Minerals
- Potassium no data
- Calcium 40 mg 5%
- Phosphorus no data
- Magnesium no data
- Iron 3.6 mg 26%
- Zinc no data
- Copper no data
- Manganese no data
- Selenium no data
- Iodine no data
- Sodium 128 mg 5%
EU criteria for nutrition claims
Which of them 100 g of this food meets under Regulation (EC) 1924/2006.
- Source of fibre
- Source of iron
Coconut
Energy and macros
- Energy 475 kcal 24%
- Protein 3.9 g 8%
- Fat 23.8 g 34%
- Carbs available, without fibre 60.2 g 23%
- Fibre 3 g
- Salt 0.5 g 8%
Where the calories come from
- Protein 3%
- Fat 46%
- Carbs 51%
Protein and carbs give 4 kcal a gram, fat 9. “Other” is fibre, alcohol and organic acids.
Vitamins
- Vitamin A 8.9 µg 1%
- Vitamin D 0.25 µg 5%
- Vitamin E 0.18 mg 2%
- Vitamin K no data
- Vitamin C 0.25 mg <1%
- Vitamin B1 thiamin 0.042 mg 4%
- Vitamin B2 riboflavin 0.18 mg 13%
- Vitamin B3 niacin 0.47 mg 3%
- Vitamin B5 pantothenic acid 0.27 mg 5%
- Vitamin B6 0.21 mg 15%
- Folate B9 25 µg 12%
- Vitamin B12 0.17 µg 7%
- Choline no data
Minerals
- Potassium 331 mg 17%
- Calcium 78.8 mg 10%
- Phosphorus 103 mg 15%
- Magnesium 46.8 mg 12%
- Iron 1.8 mg 13%
- Zinc 0.8 mg 8%
- Copper 0.3 mg 30%
- Manganese 0.6 mg 30%
- Selenium 1 µg 2%
- Iodine 11 µg 7%
- Sodium 200 mg 8%
EU criteria for nutrition claims
Which of them 100 g of this food meets under Regulation (EC) 1924/2006.
- Source of fibre
- High in copper
- High in manganese
- Source of potassium
- Source of vitamin B6
Sweets and desserts
Among sweets and desserts
The category in the 17 Fit catalog: 254 foods. Compared per 100 g.
- 94% More calories than 94% of sweets and desserts.
- 90% More phosphorus than 90% of sweets and desserts.
- 97% More calcium than 97% of sweets and desserts.
- 87% More vitamin E than 87% of sweets and desserts.
- 89% More potassium than 89% of sweets and desserts.
Similar in composition
The foods with the nearest calories and macros.
- Chocolate spread 539 kcal
- Milk chocolate 535 kcal
- White chocolate 539 kcal
- Tortilla chips 497 kcal
- Chocolate chip cookies 481 kcal
- Digestives 463 kcal
17 Fit
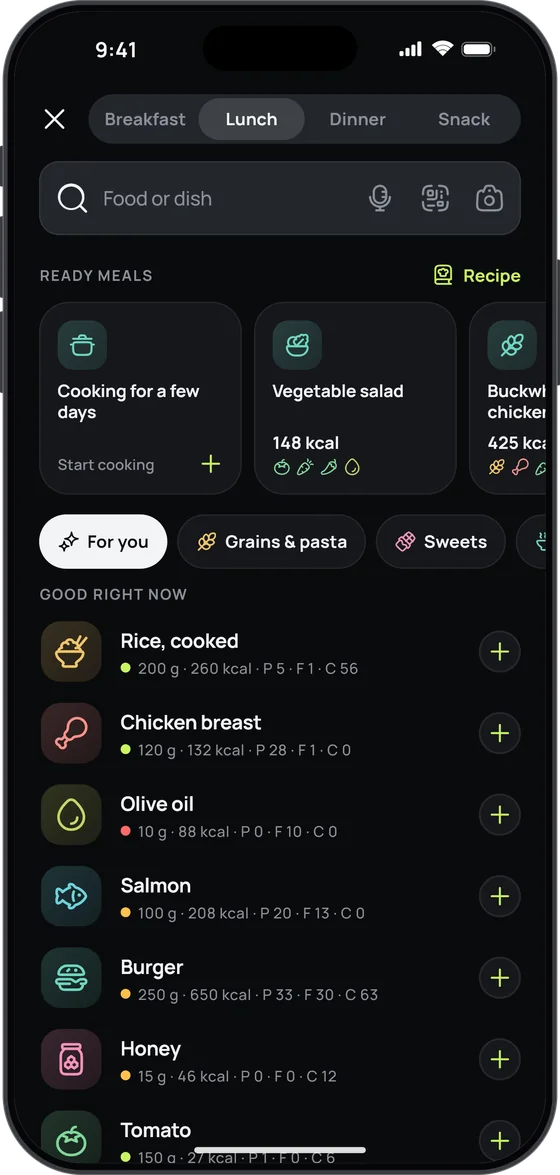
Count calories without scales or tables
Snap your plate or just say what you ate — 17 Fit recognises the dishes, estimates the grams and counts the calories, macros, vitamins and minerals.
- Photo, voice or a search among 2,557 foods and dishes
- A plan that adjusts to your weight every week
- Free food diary, no sign-up and no ads

Where these numbers come from
ANSES-CIQUAL (France), code 31000.
Carbs are available carbohydrates, without fibre, as on EU labels.