17 Fit Food calories Sweets and desserts
Milk chocolate calories and nutrition facts
Per 100 g: 535 kcal — 7.7 g protein, 29.7 g fat and 56 g carbs.
Milk chocolate has more sugar and milk and less cocoa than dark chocolate, which gives it the sweet, creamy taste British bars are known for. Whole hazelnuts or almonds barely change the calories, about 552 kcal per 100 g against 535 plain, but a sharing bar rarely gets shared. A few squares make a practical unit to log, and it’s rich in copper.
- Source of fibre
- Low salt
- High in copper
- High in vitamin B12
- Protein 6%
- Fat 51%
- Carbs 43%
In everyday portions
- Typical serving · 25 g 134 kcal
- 100 kcal is 19 g this much of it gives 100 kcal
- 20 g of protein is 260 g this much to eat for 20 g of protein
- Energy density High 5.3 kcal per gram: the lower it is, the more food you get for the same calories
All the variants
How the calories and macros change with the variety and the cooking. Values per 100 g.
| Variant | Kcal | Protein | Fat | Carbs |
|---|---|---|---|---|
| Plain | 535 | 7.7 | 29.7 | 56 |
| With nuts | 552 | 8.4 | 35.9 | 48.7 |
Nutrition per 100 g
The percentage is the share of an adult’s daily reference intake set by the EU (Regulation 1169/2011).
Plain
Energy and macros
- Energy 535 kcal 27%
- Protein 7.7 g 15%
- Fat 29.7 g 42%
- Carbs available, without fibre 56 g 22%
- Fibre 3.4 g
- Salt 0.2 g 3%
Where the calories come from
- Protein 6%
- Fat 51%
- Carbs 43%
Protein and carbs give 4 kcal a gram, fat 9. “Other” is fibre, alcohol and organic acids.
Vitamins
- Vitamin A 59 µg 7%
- Vitamin D 0 µg 0%
- Vitamin E 0.51 mg 4%
- Vitamin K 5.7 µg 8%
- Vitamin C 0 mg 0%
- Vitamin B1 (thiamin) 0.112 mg 10%
- Vitamin B2 (riboflavin) 0.298 mg 21%
- Vitamin B3 (niacin) 0.386 mg 2%
- Vitamin B5 (pantothenic acid) 0.472 mg 8%
- Vitamin B6 0.036 mg 3%
- Folate (B9) 11 µg 6%
- Vitamin B12 0.75 µg 30%
- Choline 46.1 mg
Minerals
- Potassium 372 mg 19%
- Calcium 189 mg 24%
- Phosphorus 208 mg 30%
- Magnesium 63 mg 17%
- Iron 2.4 mg 17%
- Zinc 2.3 mg 23%
- Copper 0.491 mg 49%
- Manganese 0.471 mg 24%
- Selenium 4.5 µg 8%
- Iodine 25.5 µg 17%
- Sodium 79 mg 3%
EU criteria for nutrition claims
Which of them 100 g of this food meets under Regulation (EC) 1924/2006.
- Source of fibre
- Low salt
- High in copper
- High in vitamin B12
- Source of phosphorus
- Source of calcium
- Source of manganese
- Source of zinc
- Source of vitamin B2
- Source of potassium
- Source of iodine
- Source of magnesium
- Source of iron
With nuts
Energy and macros
- Energy 552 kcal 28%
- Protein 8.4 g 17%
- Fat 35.9 g 51%
- Carbs available, without fibre 48.7 g 19%
- Fibre 3.5 g
- Salt 0.25 g 4%
Where the calories come from
- Protein 6%
- Fat 59%
- Carbs 35%
Protein and carbs give 4 kcal a gram, fat 9. “Other” is fibre, alcohol and organic acids.
Vitamins
- Vitamin A 38.8 µg 5%
- Vitamin D 0.25 µg 5%
- Vitamin E 0.25 mg 2%
- Vitamin K 0 µg 0%
- Vitamin C 0.05 mg <1%
- Vitamin B1 (thiamin) 0.13 mg 12%
- Vitamin B2 (riboflavin) 0.39 mg 28%
- Vitamin B3 (niacin) 0.57 mg 4%
- Vitamin B5 (pantothenic acid) 0.8 mg 13%
- Vitamin B6 0.4 mg 29%
- Folate (B9) 42 µg 21%
- Vitamin B12 0.32 µg 13%
- Choline no data
Minerals
- Potassium 617 mg 31%
- Calcium 187 mg 23%
- Phosphorus 206 mg 29%
- Magnesium 61 mg 16%
- Iron 1.4 mg 10%
- Zinc 0.98 mg 10%
- Copper 0.44 mg 44%
- Manganese 1.1 mg 55%
- Selenium 5 µg 9%
- Iodine 17 µg 11%
- Sodium 101 mg 4%
EU criteria for nutrition claims
Which of them 100 g of this food meets under Regulation (EC) 1924/2006.
- Source of fibre
- Low salt
- High in manganese
- High in copper
- High in potassium
- Source of phosphorus
- Source of vitamin B6
- Source of vitamin B2
- Source of calcium
- Source of folate
- Source of magnesium
Sweets and desserts
Among sweets and desserts
The category in the 17 Fit catalog: 254 foods. Compared per 100 g.
- 95% More calories than 95% of sweets and desserts.
- 87% More protein than 87% of sweets and desserts.
- 83% More fibre than 83% of sweets and desserts.
- 88% More copper than 88% of sweets and desserts.
- 96% More vitamin B12 than 96% of sweets and desserts.
Similar in composition
The foods with the nearest calories and macros.
- Chocolate spread 539 kcal
- Digestives 463 kcal
- Halva 469 kcal
- Doughnuts 426 kcal
- Dark chocolate 598 kcal
- Oatmeal cookies 450 kcal
17 Fit
Count calories without scales or tables
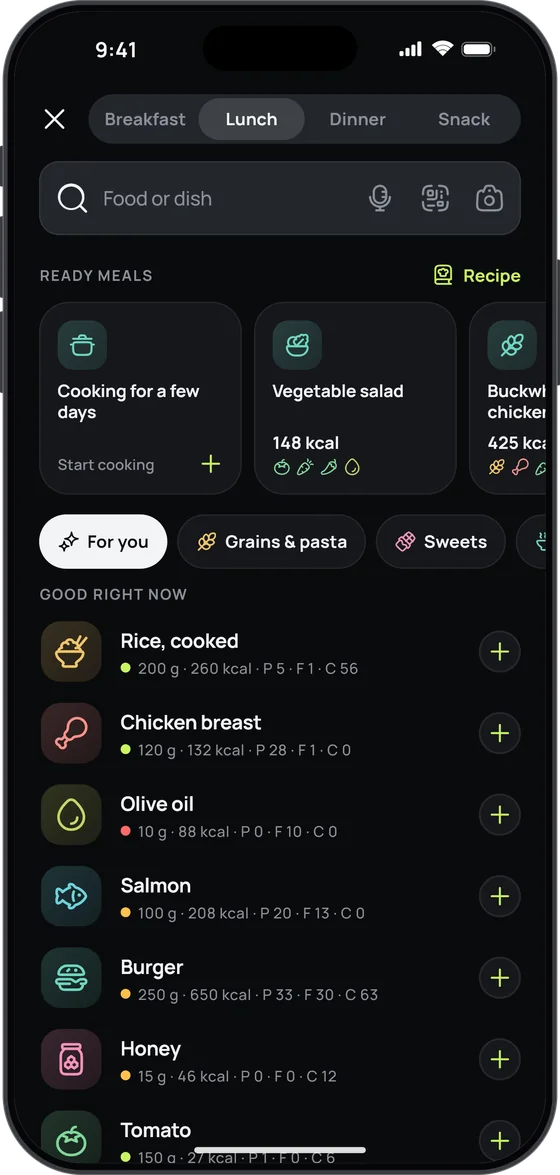
Snap your plate or just say what you ate — 17 Fit recognises the dishes, estimates the grams and counts the calories, macros, vitamins and minerals.
- Photo, voice or a search among 2,557 foods and dishes
- A plan that adjusts to your weight every week
- Free food diary, no sign-up and no ads

Where these numbers come from
USDA FoodData Central (SR Legacy, USA), code 167587.
The vitamins and minerals it lacked come from BLS (Germany).
Carbs are available carbohydrates, without fibre, as on EU labels.