17 Fit Food calories Oils, sauces and condiments
Hummus calories and nutrition facts
Per 100 g: 237 kcal — 7.8 g protein, 17.8 g fat and 9.5 g carbs.
Blended from chickpeas, tahini, lemon, garlic and olive oil, hummus varies mostly with the oil: a typical shop version is about 237 kcal per 100 g, a lighter homemade batch nearer 177. As a dip it disappears fast, so a tablespoon is a fair unit to count. The shop-bought kind is rich in manganese and copper.
- Source of protein
- Source of fibre
- High in manganese
- High in copper
- Protein 14%
- Fat 70%
- Carbs 17%
In everyday portions
- 1 tbsp ≈ 15 g 36 kcal
- Typical serving · 50 g 118 kcal
- 100 kcal is 42 g this much of it gives 100 kcal
- 20 g of protein is 255 g this much to eat for 20 g of protein
- Energy density Medium 2.4 kcal per gram: the lower it is, the more food you get for the same calories
All the variants
How the calories and macros change with the variety and the cooking. Values per 100 g.
| Variant | Kcal | Protein | Fat | Carbs |
|---|---|---|---|---|
| Shop-bought | 237 | 7.8 | 17.8 | 9.5 |
| Homemade | 177 | 4.9 | 8.6 | 16.1 |
Nutrition per 100 g
The percentage is the share of an adult’s daily reference intake set by the EU (Regulation 1169/2011).
Shop-bought
Energy and macros
- Energy 237 kcal 12%
- Protein 7.8 g 16%
- Fat 17.8 g 25%
- Carbs available, without fibre 9.5 g 4%
- Fibre 5.5 g
- Salt 1.1 g 18%
Where the calories come from
- Protein 14%
- Fat 70%
- Carbs 17%
Protein and carbs give 4 kcal a gram, fat 9. “Other” is fibre, alcohol and organic acids.
Vitamins
- Vitamin A 1 µg <1%
- Vitamin D 0 µg 0%
- Vitamin E 1.5 mg 13%
- Vitamin K 22.8 µg 30%
- Vitamin C 0 mg 0%
- Vitamin B1 (thiamin) 0.16 mg 15%
- Vitamin B2 (riboflavin) 0.127 mg 9%
- Vitamin B3 (niacin) 1 mg 6%
- Vitamin B5 (pantothenic acid) 0.346 mg 6%
- Vitamin B6 0.146 mg 10%
- Folate (B9) 48 µg 24%
- Vitamin B12 0 µg 0%
- Choline no data
Minerals
- Potassium 312 mg 16%
- Calcium 47 mg 6%
- Phosphorus 181 mg 26%
- Magnesium 75 mg 20%
- Iron 2.5 mg 18%
- Zinc 1.4 mg 14%
- Copper 0.377 mg 38%
- Manganese 1.2 mg 58%
- Selenium 4.7 µg 9%
- Iodine 1.3 µg <1%
- Sodium 426 mg 18%
EU criteria for nutrition claims
Which of them 100 g of this food meets under Regulation (EC) 1924/2006.
- Source of protein
- Source of fibre
- High in manganese
- High in copper
- High in vitamin K
- Source of phosphorus
- Source of folate
- Source of magnesium
- Source of iron
- Source of potassium
Homemade
Energy and macros
- Energy 177 kcal 9%
- Protein 4.9 g 10%
- Fat 8.6 g 12%
- Carbs available, without fibre 16.1 g 6%
- Fibre 4 g
- Salt 0.6 g 10%
Where the calories come from
- Protein 11%
- Fat 44%
- Carbs 36%
- Other 9%
Protein and carbs give 4 kcal a gram, fat 9. “Other” is fibre, alcohol and organic acids.
Vitamins
- Vitamin A 0 µg 0%
- Vitamin D 0 µg 0%
- Vitamin E 0.75 mg 6%
- Vitamin K 3 µg 4%
- Vitamin C 7.9 mg 10%
- Vitamin B1 (thiamin) 0.089 mg 8%
- Vitamin B2 (riboflavin) 0.052 mg 4%
- Vitamin B3 (niacin) 0.399 mg 2%
- Vitamin B5 (pantothenic acid) 0.287 mg 5%
- Vitamin B6 0.399 mg 29%
- Folate (B9) 59 µg 30%
- Vitamin B12 0 µg 0%
- Choline 27.8 mg
Minerals
- Potassium 173 mg 9%
- Calcium 49 mg 6%
- Phosphorus 110 mg 16%
- Magnesium 29 mg 8%
- Iron 1.6 mg 11%
- Zinc 1.1 mg 11%
- Copper 0.224 mg 22%
- Manganese 0.567 mg 28%
- Selenium 2.4 µg 4%
- Iodine no data
- Sodium 242 mg 10%
EU criteria for nutrition claims
Which of them 100 g of this food meets under Regulation (EC) 1924/2006.
- Source of fibre
- Source of folate
- Source of vitamin B6
- Source of manganese
- Source of copper
- Source of phosphorus
Oils, sauces and condiments
Among oils, sauces and condiments
The category in the 17 Fit catalog: 98 foods. Compared per 100 g.
- 97% More protein than 97% of oils, sauces and condiments.
- 96% More fibre than 96% of oils, sauces and condiments.
- 98% More manganese than 98% of oils, sauces and condiments.
- 96% More copper than 96% of oils, sauces and condiments.
- 95% More phosphorus than 95% of oils, sauces and condiments.
Similar in composition
The foods with the nearest calories and macros.
- Mustard 60 kcal
- Pesto 418 kcal
- Ketchup 112 kcal
- Passata 29 kcal
- Mayonnaise 680 kcal
- Margarine 717 kcal
17 Fit
Count calories without scales or tables
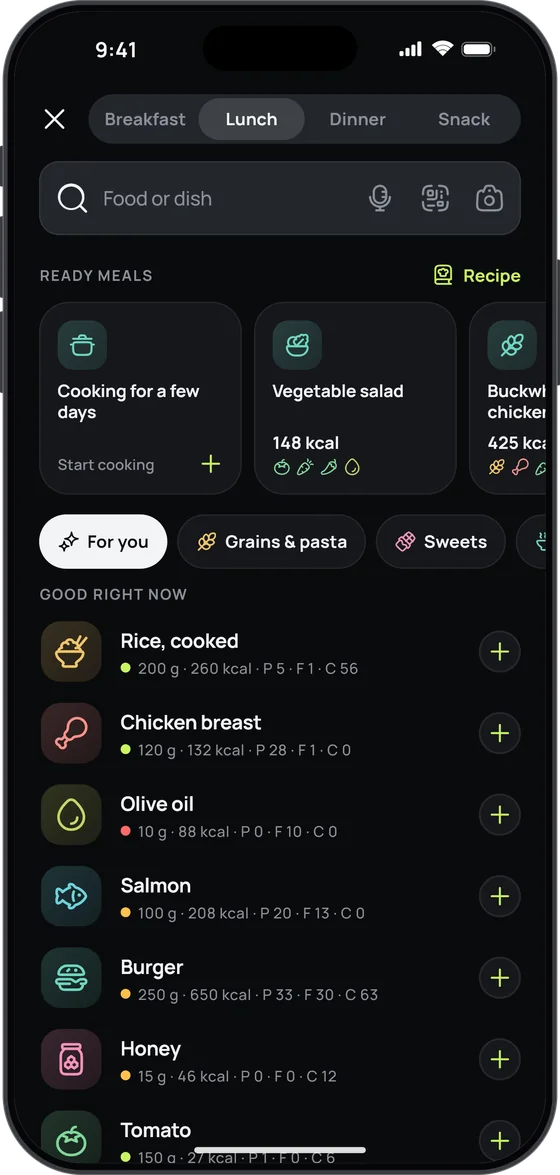
Snap your plate or just say what you ate — 17 Fit recognises the dishes, estimates the grams and counts the calories, macros, vitamins and minerals.
- Photo, voice or a search among 2,557 foods and dishes
- A plan that adjusts to your weight every week
- Free food diary, no sign-up and no ads

Where these numbers come from
USDA FoodData Central (SR Legacy, USA), code 174289.
The vitamins and minerals it lacked come from the Swiss Food Composition Database.
Carbs are available carbohydrates, without fibre, as on EU labels.