17 Fit Food calories Sweets and desserts
Ice cream calories and nutrition facts
Per 100 g: 227 kcal — 3.2 g protein, 15 g fat and 20 g carbs.
Dairy ice cream has around 215–230 kcal per 100 g whatever the flavour, so it’s the number of scoops that counts. Because it’s churned with air, a cup or scoop is a poor guide to weight – use a scale or the weight printed on a single-serve tub. Cones, wafers, chocolate sauce and sprinkles all add to the total.
- Low salt
- Source of vitamin B2
- Source of calcium
- Source of vitamin B12
- Protein 6%
- Fat 59%
- Carbs 35%
In everyday portions
- 100 kcal is 44 g this much of it gives 100 kcal
- Energy density Medium 2.3 kcal per gram: the lower it is, the more food you get for the same calories
All the variants
How the calories and macros change with the variety and the cooking. Values per 100 g.
| Variant | Kcal | Protein | Fat | Carbs |
|---|---|---|---|---|
| Dairy ice cream | 227 | 3.2 | 15 | 20 |
| Chocolate | 216 | 3.8 | 11 | 27 |
| Cone | 287 | 3.5 | 13.5 | 37.8 |
| Cup | 234 | 3.2 | 12.7 | 26.7 |
Nutrition per 100 g
The percentage is the share of an adult’s daily reference intake set by the EU (Regulation 1169/2011).
Dairy ice cream
Energy and macros
- Energy 227 kcal 11%
- Protein 3.2 g 6%
- Fat 15 g 21%
- Carbs including fibre 20 g 8%
- Fibre 0.7 g
- Salt 0.2 g 3%
Where the calories come from
- Protein 6%
- Fat 59%
- Carbs 35%
Protein and carbs give 4 kcal a gram, fat 9. “Other” is fibre, alcohol and organic acids.
Vitamins
- Vitamin A 118 µg 15%
- Vitamin D 0.2 µg 4%
- Vitamin E 0.3 mg 2%
- Vitamin K 0.3 µg <1%
- Vitamin C 0.6 mg <1%
- Vitamin B1 (thiamin) 0.041 mg 4%
- Vitamin B2 (riboflavin) 0.24 mg 17%
- Vitamin B3 (niacin) 0.116 mg <1%
- Vitamin B5 (pantothenic acid) 0.581 mg 10%
- Vitamin B6 0.048 mg 3%
- Folate (B9) 5 µg 2%
- Vitamin B12 0.39 µg 16%
- Choline 26 mg
Minerals
- Potassium 199 mg 10%
- Calcium 128 mg 16%
- Phosphorus 105 mg 15%
- Magnesium 14 mg 4%
- Iron 0.09 mg <1%
- Zinc 0.69 mg 7%
- Copper 0.023 mg 2%
- Manganese 0.008 mg <1%
- Selenium 1.8 µg 3%
- Iodine 13 µg 9%
- Sodium 80 mg 3%
EU criteria for nutrition claims
Which of them 100 g of this food meets under Regulation (EC) 1924/2006.
- Low salt
- Source of vitamin B2
- Source of calcium
- Source of vitamin B12
- Source of phosphorus
Chocolate
Energy and macros
- Energy 216 kcal 11%
- Protein 3.8 g 8%
- Fat 11 g 16%
- Carbs available, without fibre 27 g 10%
- Fibre 1.2 g
- Salt 0.19 g 3%
Where the calories come from
- Protein 7%
- Fat 45%
- Carbs 49%
Protein and carbs give 4 kcal a gram, fat 9. “Other” is fibre, alcohol and organic acids.
Vitamins
- Vitamin A 118 µg 15%
- Vitamin D 0.2 µg 4%
- Vitamin E 0.3 mg 2%
- Vitamin K 0.3 µg <1%
- Vitamin C 0.7 mg <1%
- Vitamin B1 (thiamin) 0.042 mg 4%
- Vitamin B2 (riboflavin) 0.194 mg 14%
- Vitamin B3 (niacin) 0.226 mg 1%
- Vitamin B5 (pantothenic acid) 0.554 mg 9%
- Vitamin B6 0.055 mg 4%
- Folate (B9) 16 µg 8%
- Vitamin B12 0.29 µg 12%
- Choline 22.5 mg
Minerals
- Potassium 249 mg 12%
- Calcium 109 mg 14%
- Phosphorus 107 mg 15%
- Magnesium 29 mg 8%
- Iron 0.93 mg 7%
- Zinc 0.58 mg 6%
- Copper 0.135 mg 14%
- Manganese 0.14 mg 7%
- Selenium 2.5 µg 5%
- Iodine 16 µg 11%
- Sodium 76 mg 3%
EU criteria for nutrition claims
Which of them 100 g of this food meets under Regulation (EC) 1924/2006.
- Low salt
- Source of phosphorus
Cone
Energy and macros
- Energy 287 kcal 14%
- Protein 3.5 g 7%
- Fat 13.5 g 19%
- Carbs available, without fibre 37.8 g 15%
- Fibre 1.5 g
- Salt 0.13 g 2%
Where the calories come from
- Protein 5%
- Fat 42%
- Carbs 53%
Protein and carbs give 4 kcal a gram, fat 9. “Other” is fibre, alcohol and organic acids.
Vitamins
- Vitamin A 0.4 µg <1%
- Vitamin D 0 µg 0%
- Vitamin E 0.77 mg 6%
- Vitamin K no data
- Vitamin C 1 mg 1%
- Vitamin B1 (thiamin) 0.05 mg 5%
- Vitamin B2 (riboflavin) 0.23 mg 16%
- Vitamin B3 (niacin) 0.21 mg 1%
- Vitamin B5 (pantothenic acid) 0.35 mg 6%
- Vitamin B6 0.07 mg 5%
- Folate (B9) 8 µg 4%
- Vitamin B12 0.13 µg 5%
- Choline no data
Minerals
- Potassium 216 mg 11%
- Calcium 109 mg 14%
- Phosphorus 100 mg 14%
- Magnesium 17.5 mg 5%
- Iron 0.95 mg 7%
- Zinc 0.5 mg 5%
- Copper 0 mg 0%
- Manganese 0 mg 0%
- Selenium 1.1 µg 2%
- Iodine 22 µg 15%
- Sodium 52 mg 2%
EU criteria for nutrition claims
Which of them 100 g of this food meets under Regulation (EC) 1924/2006.
- Low salt
- Source of vitamin B2
Cup
Energy and macros
- Energy 234 kcal 12%
- Protein 3.2 g 6%
- Fat 12.7 g 18%
- Carbs available, without fibre 26.7 g 10%
- Fibre 1.9 g
- Salt 0.15 g 2%
Where the calories come from
- Protein 5%
- Fat 49%
- Carbs 46%
Protein and carbs give 4 kcal a gram, fat 9. “Other” is fibre, alcohol and organic acids.
Vitamins
- Vitamin A no data
- Vitamin D no data
- Vitamin E no data
- Vitamin K no data
- Vitamin C no data
- Vitamin B1 (thiamin) no data
- Vitamin B2 (riboflavin) no data
- Vitamin B3 (niacin) no data
- Vitamin B5 (pantothenic acid) no data
- Vitamin B6 no data
- Folate (B9) no data
- Vitamin B12 no data
- Choline no data
Minerals
- Potassium no data
- Calcium no data
- Phosphorus no data
- Magnesium no data
- Iron no data
- Zinc no data
- Copper no data
- Manganese no data
- Selenium no data
- Iodine no data
- Sodium 59.6 mg 2%
EU criteria for nutrition claims
Which of them 100 g of this food meets under Regulation (EC) 1924/2006.
- Low salt
Sweets and desserts
Among sweets and desserts
The category in the 17 Fit catalog: 254 foods. Compared per 100 g.
- 86% Fewer calories than 86% of sweets and desserts.
- 82% More vitamin B2 than 82% of sweets and desserts.
- 84% More calcium than 84% of sweets and desserts.
- 83% More vitamin B12 than 83% of sweets and desserts.
Similar in composition
The foods with the nearest calories and macros.
- Apple pie 237 kcal
- Trifle 167 kcal
- Éclair 264 kcal
- Tiramisu 353 kcal
- Blueberry muffins 375 kcal
- Chocolate cake 389 kcal
17 Fit
Count calories without scales or tables
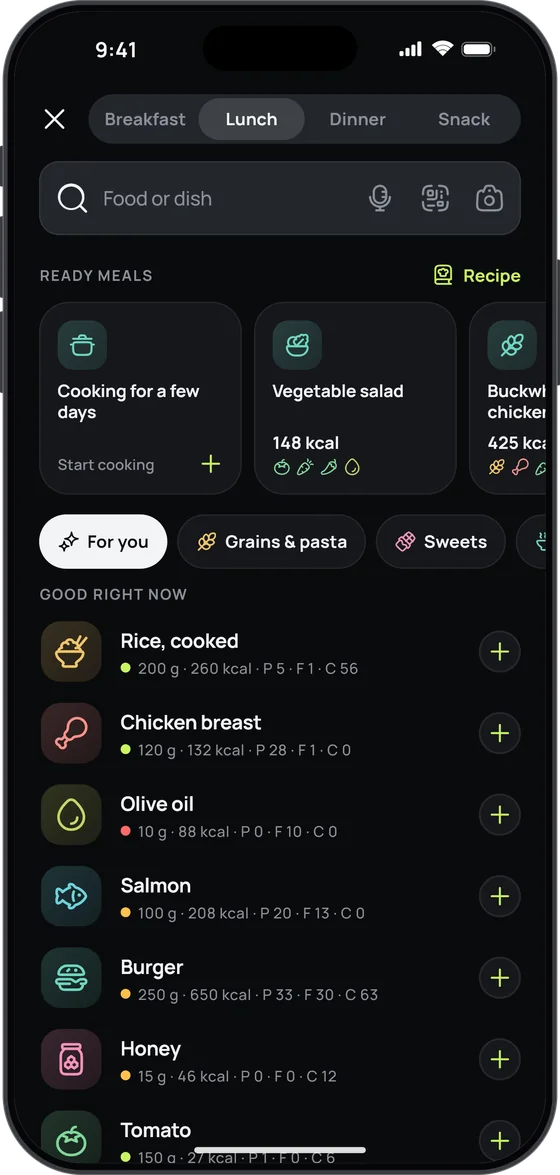
Snap your plate or just say what you ate — 17 Fit recognises the dishes, estimates the grams and counts the calories, macros, vitamins and minerals.
- Photo, voice or a search among 2,557 foods and dishes
- A plan that adjusts to your weight every week
- Free food diary, no sign-up and no ads

Where these numbers come from
Calories and macros: 17 Fit’s reference values, the same as in the app.
Vitamins and minerals: USDA FoodData Central (SR Legacy, USA).
Carbs are given including fibre.