17 Fit Food calories Bread and pastries
White bread calories and nutrition facts
Per 100 g: 265 kcal — 9 g protein, 3.2 g fat and 49 g carbs.
Toasting doesn’t add calories – it only drives out water, which is why toast shows more kcal per 100 g than the same slice untoasted. A slice from a sliced sandwich loaf weighs about 25 g, while thick-cut bakery slices can be much heavier, so weigh one once. What goes on top – butter, jam, cheese – often carries as much as the bread itself.
- Source of protein
- Source of fibre
- High in manganese
- Source of selenium
- Protein 14%
- Fat 11%
- Carbs 75%
In everyday portions
- 1 slice ≈ 30 g 80 kcal
- Typical serving · 60 g 159 kcal
- 100 kcal is 38 g this much of it gives 100 kcal
- 20 g of protein is 220 g this much to eat for 20 g of protein
- Energy density Medium 2.6 kcal per gram: the lower it is, the more food you get for the same calories
All the variants
How the calories and macros change with the variety and the cooking. Values per 100 g.
| Variant | Kcal | Protein | Fat | Carbs |
|---|---|---|---|---|
| White bread | 265 | 9 | 3.2 | 49 |
| Sandwich loaf | 278 | 7.1 | 3.6 | 52.3 |
| Toasted | 317 | 9.5 | 1.3 | 64 |
Nutrition per 100 g
The percentage is the share of an adult’s daily reference intake set by the EU (Regulation 1169/2011).
White bread
Energy and macros
- Energy 265 kcal 13%
- Protein 9 g 18%
- Fat 3.2 g 5%
- Carbs including fibre 49 g 19%
- Fibre 3.8 g
- Salt 1.3 g 21%
Where the calories come from
- Protein 14%
- Fat 11%
- Carbs 75%
Protein and carbs give 4 kcal a gram, fat 9. “Other” is fibre, alcohol and organic acids.
Vitamins
- Vitamin A 0 µg 0%
- Vitamin D 0.16 µg 3%
- Vitamin E 0.28 mg 2%
- Vitamin K 0.6 µg <1%
- Vitamin C 0.3 mg <1%
- Vitamin B1 (thiamin) 0.098 mg 9%
- Vitamin B2 (riboflavin) 0.01 mg <1%
- Vitamin B3 (niacin) 0.63 mg 4%
- Vitamin B5 (pantothenic acid) 0.41 mg 7%
- Vitamin B6 0.023 mg 2%
- Folate (B9) 23 µg 12%
- Vitamin B12 0 µg 0%
- Choline no data
Minerals
- Potassium 165 mg 8%
- Calcium 31.1 mg 4%
- Phosphorus 108 mg 15%
- Magnesium 27.7 mg 7%
- Iron 1.2 mg 9%
- Zinc 0.75 mg 8%
- Copper 0.14 mg 14%
- Manganese 0.67 mg 34%
- Selenium 10.3 µg 19%
- Iodine 4.5 µg 3%
- Sodium 512 mg 21%
EU criteria for nutrition claims
Which of them 100 g of this food meets under Regulation (EC) 1924/2006.
- Source of protein
- Source of fibre
- High in manganese
- Source of selenium
- Source of phosphorus
Sandwich loaf
Energy and macros
- Energy 278 kcal 14%
- Protein 7.1 g 14%
- Fat 3.6 g 5%
- Carbs available, without fibre 52.3 g 20%
- Fibre 1.8 g
- Salt 1.1 g 19%
Where the calories come from
- Protein 11%
- Fat 12%
- Carbs 77%
Protein and carbs give 4 kcal a gram, fat 9. “Other” is fibre, alcohol and organic acids.
Vitamins
- Vitamin A 0.2 µg <1%
- Vitamin D 0 µg 0%
- Vitamin E 0.12 mg 1%
- Vitamin K 2.2 µg 3%
- Vitamin C 0.25 mg <1%
- Vitamin B1 (thiamin) 0.12 mg 11%
- Vitamin B2 (riboflavin) 0.015 mg 1%
- Vitamin B3 (niacin) 0.31 mg 2%
- Vitamin B5 (pantothenic acid) 0.43 mg 7%
- Vitamin B6 0.03 mg 2%
- Folate (B9) 13.3 µg 7%
- Vitamin B12 no data
- Choline no data
Minerals
- Potassium 120 mg 6%
- Calcium 88 mg 11%
- Phosphorus 75 mg 11%
- Magnesium 17 mg 5%
- Iron 0.7 mg 5%
- Zinc 0.47 mg 5%
- Copper 0.11 mg 11%
- Manganese 0.43 mg 22%
- Selenium 10 µg 18%
- Iodine 10 µg 7%
- Sodium 459 mg 19%
EU criteria for nutrition claims
Which of them 100 g of this food meets under Regulation (EC) 1924/2006.
- Source of manganese
- Source of selenium
Toasted
Energy and macros
- Energy 317 kcal 16%
- Protein 9.5 g 19%
- Fat 1.3 g 2%
- Carbs available, without fibre 64 g 25%
- Fibre 3.7 g
- Salt 1.5 g 25%
Where the calories come from
- Protein 12%
- Fat 4%
- Carbs 84%
Protein and carbs give 4 kcal a gram, fat 9. “Other” is fibre, alcohol and organic acids.
Vitamins
- Vitamin A 1 µg <1%
- Vitamin D 0.125 µg 2%
- Vitamin E 0.24 mg 2%
- Vitamin K 0.4 µg <1%
- Vitamin C 0.25 mg <1%
- Vitamin B1 (thiamin) 0.11 mg 10%
- Vitamin B2 (riboflavin) 0.018 mg 1%
- Vitamin B3 (niacin) 0.33 mg 2%
- Vitamin B5 (pantothenic acid) 0.58 mg 10%
- Vitamin B6 0.044 mg 3%
- Folate (B9) 19.6 µg 10%
- Vitamin B12 no data
- Choline no data
Minerals
- Potassium 140 mg 7%
- Calcium 20 mg 2%
- Phosphorus 85 mg 12%
- Magnesium 25 mg 7%
- Iron 0.97 mg 7%
- Zinc 0.65 mg 6%
- Copper 0.11 mg 11%
- Manganese 0.51 mg 26%
- Selenium 10 µg 18%
- Iodine 10 µg 7%
- Sodium 602 mg 25%
EU criteria for nutrition claims
Which of them 100 g of this food meets under Regulation (EC) 1924/2006.
- Source of fibre
- Low fat
- Source of manganese
- Source of selenium
Bread and pastries
Among breads and pastries
The category in the 17 Fit catalog: 128 foods. Compared per 100 g.
- 71% Fewer calories than 71% of breads and pastries.
- 70% More fibre than 70% of breads and pastries.
Similar in composition
The foods with the nearest calories and macros.
- Rye bread 259 kcal
- Bagels 275 kcal
- Bread rolls 293 kcal
- Pitta bread 259 kcal
- Lavash 275 kcal
- Baguette 287 kcal
17 Fit
Count calories without scales or tables
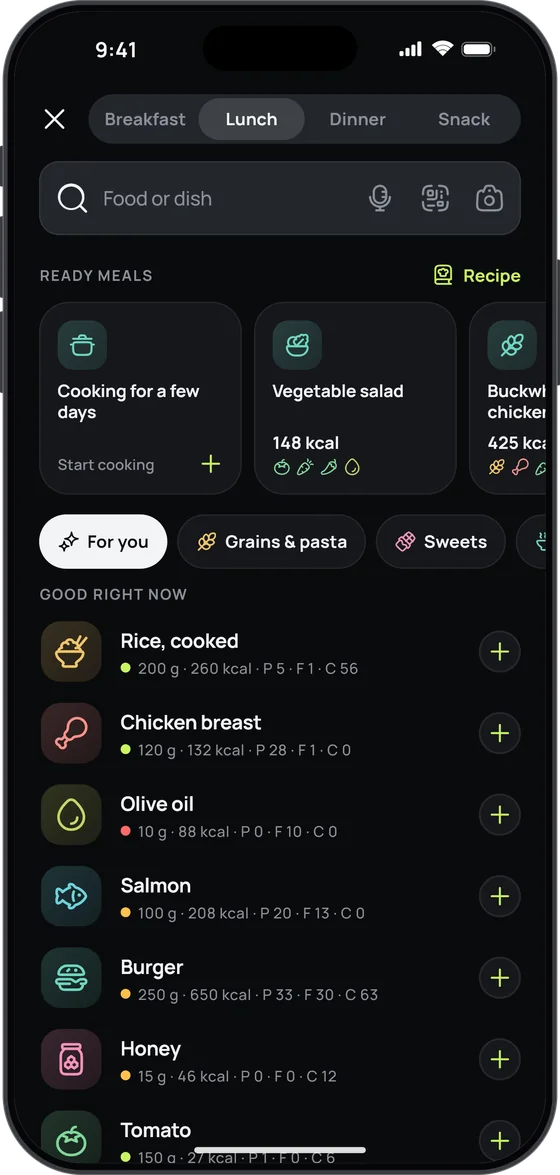
Snap your plate or just say what you ate — 17 Fit recognises the dishes, estimates the grams and counts the calories, macros, vitamins and minerals.
- Photo, voice or a search among 2,557 foods and dishes
- A plan that adjusts to your weight every week
- Free food diary, no sign-up and no ads

Where these numbers come from
Calories and macros: 17 Fit’s reference values, the same as in the app.
Vitamins and minerals: ANSES-CIQUAL (France).
Carbs are given including fibre.