17 Fit Food calories Snacks, spices and more
Cinnamon calories and nutrition facts
Cinnamon: 247 kcal per 100 g, protein 4 g, fat 1.2 g, carbs 27.5 g. 1 tsp (3 g): 7 kcal.
Most ground cinnamon sold in the US is cassia, the sweet, bold bark behind cinnamon rolls, apple pie and oatmeal toppings, while Ceylon cinnamon is milder and pricier. Per 100 g it’s rich in calcium and iron, but a 3 g teaspoon adds only around 7 kcal; in a cinnamon roll, the dough, butter and icing are what count.
- High in fibre
- Low fat
- Very low salt
- High in manganese
- Protein 6%
- Fat 5%
- Carbs 45%
- Other 45%
In everyday portions
- 1 tsp ≈ 3 g 7 kcal P 0.1 · F 0 · C 0.8 g
- 100 kcal is 40 g this much of it gives 100 kcal
- Energy density Medium 2.5 kcal per gram: the lower it is, the more food you get for the same calories
Nutrition per 100 g
The percentage is the share of an adult’s daily reference intake set by the EU (Regulation 1169/2011). What the % means
Energy and macros
- Energy 247 kcal 1,033 kJ 12%
- Protein 4 g 8%
- Fat 1.2 g 2%
- Carbs available, without fibre 27.5 g 11%
- Fibre 53.1 g
- Salt 0.03 g <1%
Where the calories come from
- Protein 6%
- Fat 5%
- Carbs 45%
- Other 45%
Protein and carbs give 4 kcal a gram, fat 9. “Other” is fibre, alcohol and organic acids.
Vitamins
- Vitamin A 15 µg 2%
- Vitamin D 0 µg 0%
- Vitamin E 2.3 mg 19%
- Vitamin K 31.2 µg 42%
- Vitamin C 3.8 mg 5%
- Vitamin B1 thiamin 0.022 mg 2%
- Vitamin B2 riboflavin 0.041 mg 3%
- Vitamin B3 niacin 1.3 mg 8%
- Vitamin B5 pantothenic acid 0.358 mg 6%
- Vitamin B6 0.158 mg 11%
- Folate B9 6 µg 3%
- Vitamin B12 0 µg 0%
- Choline 11 mg
Minerals
- Potassium 431 mg 22%
- Calcium 1,002 mg 125%
- Phosphorus 64 mg 9%
- Magnesium 60 mg 16%
- Iron 8.3 mg 59%
- Zinc 1.8 mg 18%
- Copper 0.339 mg 34%
- Manganese 17.5 mg 873%
- Selenium 3.1 µg 6%
- Iodine 5 µg 3%
- Sodium 10 mg <1%
EU criteria for nutrition claims
Which of them 100 g of this food meets under Regulation (EC) 1924/2006.
- High in fibre
- Low fat
- Very low salt
- High in manganese
- High in calcium
- High in iron
- High in vitamin K
- High in copper
- Source of potassium
- Source of vitamin E
- Source of zinc
- Source of magnesium
Snacks, spices and more
Among snacks, spices and more
The category in the 17 Fit catalog: 77 foods. Compared per 100 g.
- 97% More fibre than 97% of snacks, spices and more.
- 90% More manganese than 90% of snacks, spices and more.
- 86% More calcium than 86% of snacks, spices and more.
- 76% More vitamin K than 76% of snacks, spices and more.
Similar in composition
The foods with the nearest calories and macros.
- Dried oregano 265 kcal
- Hoisin sauce 220 kcal
- Black pepper 251 kcal
- Vanilla extract 240 kcal
- Cranberry sauce 159 kcal
- Wasabi 292 kcal
More in Snacks, spices and more
- Sriracha 93 kcal
- Tempeh 192 kcal
- Seitan 134 kcal
- Teriyaki sauce 89 kcal
- Nutritional yeast 334 kcal
- Seaweed snacks 301 kcal
17 Fit
Count calories without scales or tables
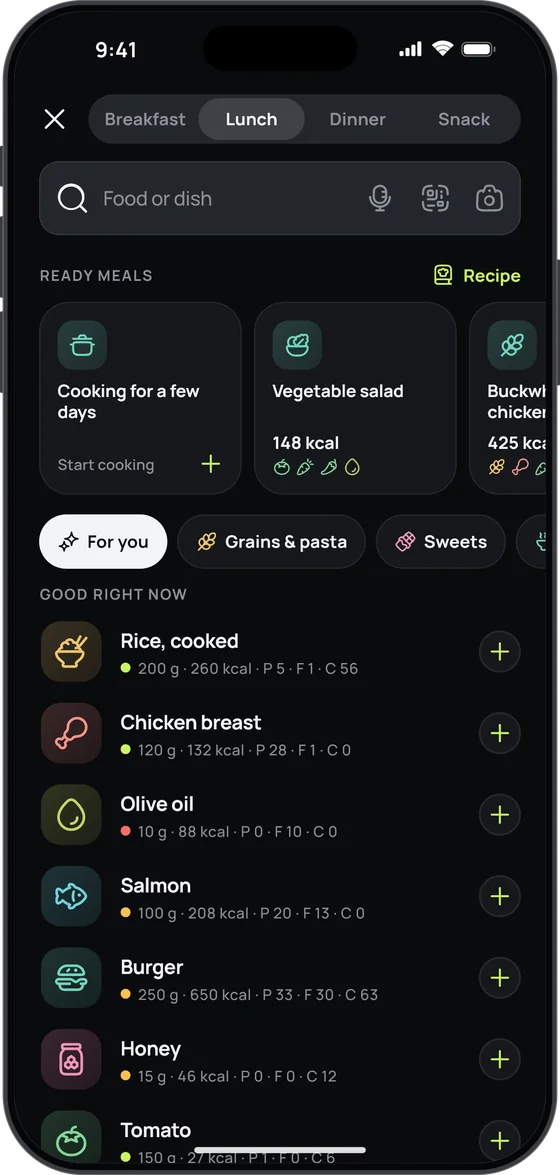
Snap your plate or just say what you ate — 17 Fit recognises the dishes, estimates the grams and counts the calories, macros, vitamins and minerals.
- Photo, voice or a search among 2,592 foods and dishes
- A plan that adjusts to your weight every week
- Free food diary, no sign-up and no ads


Where these numbers come from
USDA FoodData Central (SR Legacy, USA), code 171320.
The vitamins and minerals it lacked come from the Swiss Food Composition Database.
Carbs are available carbohydrates, without fibre, as on EU labels.