17 Fit Food calories Food rankings
Foods high in magnesium per 100 g and per portion
105 foods on 17 Fit meet the EU criterion “source of magnesium”. The most per 100 g: hemp seeds, pumpkin seeds and flaxseed.
Seeds and nuts dominate any magnesium table: hemp, pumpkin, flax, chia and sunflower seeds, Brazil nuts, cashews and almonds, followed by cocoa, whole grains and legumes. Per 100 g they’re far ahead of everything else, but a usual portion of seeds is a spoonful or a small handful, so the portion column tells you more about an ordinary day. Leafy greens and beans add up through bigger portions. Percentages are of the EU reference intake of 375 mg a day.
The top 10 per 100 g
- 1 Hemp seeds 700 mg 187% · high
- 2 Pumpkin seeds 592 mg 158% · high
- 3 Flaxseed 392 mg 105% · high
- 4 Brazil nuts 376 mg 100% · high
- 5 Chia seeds 335 mg 89% · high
- 6 Sunflower seeds 325 mg 87% · high
- 7 TVP (textured vegetable protein) · Dry 313 mg 83% · high
- 8 Sunflower seed butter 311 mg 83% · high
- 9 Cashews 292 mg 78% · high
- 10 Almonds · Roasted 279 mg 74% · high
The whole list
Per 100 g and per usual portion. Tap a column heading to sort.
| Food | |||||
|---|---|---|---|---|---|
| 1 | Hemp seeds1 tbsp ≈ 10 g | 700 mg | 187% | 70 mg | 553 |
| 2 | Pumpkin seedsTypical serving · 30 g | 592 mg | 158% | 178 mg | 559 |
| 3 | Flaxseed1 tbsp ≈ 10 g | 392 mg | 105% | 39.2 mg | 534 |
| 4 | Brazil nutsTypical serving · 20 g | 376 mg | 100% | 75.2 mg | 659 |
| 5 | Chia seeds1 tbsp ≈ 12 g | 335 mg | 89% | 40.2 mg | 486 |
| 6 | Sunflower seedsTypical serving · 30 g | 325 mg | 87% | 97.5 mg | 584 |
| 7 | TVP (textured vegetable protein) · DryTypical serving · 30 g | 313 mg | 83% | 93.9 mg | 366 |
| 8 | Sunflower seed butter1 tbsp ≈ 16 g | 311 mg | 83% | 49.8 mg | 617 |
| 9 | CashewsTypical serving · 30 g | 292 mg | 78% | 87.6 mg | 553 |
| 10 | Almonds · RoastedTypical serving · 30 g | 279 mg | 74% | 83.7 mg | 598 |
| 11 | Almond butter1 tbsp ≈ 16 g | 279 mg | 74% | 44.6 mg | 614 |
| 12 | Cashew butter1 tbsp ≈ 16 g | 258 mg | 69% | 41.3 mg | 587 |
| 13 | Pine nutsTypical serving · 20 g | 251 mg | 67% | 50.2 mg | 673 |
| 14 | Buckwheat flour1 tbsp ≈ 10 g | 251 mg | 67% | 25.1 mg | 335 |
| 15 | Amaranth · RawTypical serving · 60 g | 248 mg | 66% | 149 mg | 369 |
| 16 | Molasses1 tbsp ≈ 20 g | 242 mg | 65% | 48.4 mg | 290 |
| 17 | Honey roasted almondsTypical serving · 30 g | 240 mg | 64% | 72 mg | 594 |
| 18 | Dark chocolateTypical serving · 20 g | 228 mg | 61% | 45.6 mg | 598 |
| 19 | Mixed nutsTypical serving · 30 g | 227 mg | 61% | 68.1 mg | 607 |
| 20 | Buckwheat · DryTypical serving · 70 g | 221 mg | 59% | 155 mg | 346 |
| 21 | HalvaTypical serving · 30 g | 218 mg | 58% | 65.4 mg | 469 |
| 22 | QuinoaTypical serving · 60 g | 197 mg | 53% | 118 mg | 368 |
| 23 | White beans · DryTypical serving · 60 g | 190 mg | 51% | 114 mg | 333 |
| 24 | Peanuts · Dry-roastedTypical serving · 30 g | 178 mg | 47% | 53.4 mg | 587 |
| 25 | Oats · Oat groatsTypical serving · 50 g | 177 mg | 47% | 88.5 mg | 389 |
| 26 | Wild riceTypical serving · 60 g | 177 mg | 47% | 106 mg | 357 |
| 27 | Fish sauce1 tbsp ≈ 18 g | 175 mg | 47% | 31.5 mg | 35 |
| 28 | Hazelnuts · RoastedTypical serving · 30 g | 173 mg | 46% | 51.9 mg | 646 |
| 29 | Black beans · DryTypical serving · 60 g | 171 mg | 46% | 103 mg | 341 |
| 30 | Peanut butter1 tbsp ≈ 16 g | 168 mg | 45% | 26.9 mg | 588 |
| 31 | GranolaTypical serving · 50 g | 168 mg | 45% | 84 mg | 489 |
| 32 | Chickpea flour1 tbsp ≈ 10 g | 166 mg | 44% | 16.6 mg | 387 |
| 33 | BulgurTypical serving · 70 g | 164 mg | 44% | 115 mg | 342 |
| 34 | Rye flour · Dark1 tbsp ≈ 10 g | 160 mg | 43% | 16 mg | 325 |
| 35 | WalnutsTypical serving · 30 g | 158 mg | 42% | 47.4 mg | 654 |
| 36 | PopcornTypical serving · 30 g | 144 mg | 38% | 43.2 mg | 387 |
| 37 | Oat flour1 tbsp ≈ 10 g | 144 mg | 38% | 14.4 mg | 404 |
| 38 | Tofu · SmokedTypical serving · 100 g | 140 mg | 37% | 140 mg | 164 |
| 39 | Kidney beans · DryTypical serving · 60 g | 138 mg | 37% | 82.8 mg | 337 |
| 40 | Wheat flour · Wholemeal1 tbsp ≈ 10 g | 137 mg | 37% | 13.7 mg | 340 |
| 41 | Spelt · RawTypical serving · 70 g | 136 mg | 36% | 95.2 mg | 344 |
| 42 | Shiitake mushrooms · DriedTypical serving · 10 g | 132 mg | 35% | 13.2 mg | 296 |
| 43 | Macadamia nutsTypical serving · 30 g | 130 mg | 35% | 39 mg | 718 |
| 44 | Pasta · Wholewheat, dryTypical serving · 80 g | 128 mg | 34% | 102 mg | 352 |
| 45 | CornmealTypical serving · 50 g | 127 mg | 34% | 63.5 mg | 362 |
| 46 | KransekakeTypical serving · 50 g | 123 mg | 33% | 61.3 mg | 441 |
| 47 | PistachiosTypical serving · 30 g | 121 mg | 32% | 36.3 mg | 560 |
| 48 | PecansTypical serving · 30 g | 121 mg | 32% | 36.3 mg | 691 |
| 49 | Cinnamon stars (Zimtsterne)1 piece ≈ 10 g | 120 mg | 32% | 12 mg | 505 |
| 50 | Brown rice · DryTypical serving · 70 g | 116 mg | 31% | 81.2 mg | 367 |
| 51 | Millet · DryTypical serving · 70 g | 114 mg | 30% | 79.8 mg | 378 |
| 52 | MuesliTypical serving · 50 g | 108 mg | 29% | 53.9 mg | 370 |
| 53 | Spinach · Sautéed in oilTypical serving · 100 g | 106 mg | 28% | 106 mg | 59 |
| 54 | Anchovies · Marinated in vinegarTypical serving · 50 g | 102 mg | 27% | 51 mg | 136 |
| 55 | Mackerel · BakedTypical serving · 150 g | 97 mg | 26% | 146 mg | 262 |
| 56 | Granola bars1 piece ≈ 25 g | 97 mg | 26% | 24.3 mg | 471 |
| 57 | Tahini1 tbsp ≈ 15 g | 95 mg | 25% | 14.3 mg | 595 |
| 58 | Soba noodles · DryTypical serving · 80 g | 95 mg | 25% | 76 mg | 336 |
| 59 | TamarindTypical serving · 30 g | 92 mg | 25% | 27.6 mg | 239 |
| 60 | Poppy seed roll1 slice ≈ 70 g | 89.3 mg | 24% | 62.5 mg | 390 |
High per 100 g but eaten only a few grams at a time, so not ranked: wheat bran, cumin, sesame seeds, poppy seeds, chewing gum.
Fortified foods aren’t ranked, since their figures are the manufacturer’s: whey protein, nutritional yeast, bran flakes, yeast extract.
The leaders of each category
In each category, up to three foods with the most per 100 g that meet the EU’s “source of” criterion.
-
Vegetables and mushrooms
- Shiitake mushrooms · Dried 132 mg 35%
- Spinach · Sautéed in oil 106 mg 28%
- Wild mushrooms · Dried mix 87 mg 23%
-
Fruit and berries
- Tamarind 92 mg 25%
- Banana chips 76 mg 20%
- Dried figs 68 mg 18%
-
Grains, legumes and flour
- Buckwheat flour 251 mg 67%
- Amaranth · Raw 248 mg 66%
- Buckwheat · Dry 221 mg 59%
-
Bread and pastries
- Taco shells 83 mg 22%
- Multigrain bread 78 mg 21%
- Whole wheat bread 75 mg 20%
-
Fish and seafood
- Anchovies · Marinated in vinegar 102 mg 27%
- Mackerel · Baked 97 mg 26%
- Salt cod 80.7 mg 22%
-
Nuts and seeds
- Hemp seeds 700 mg 187%
- Pumpkin seeds 592 mg 158%
- Flaxseed 392 mg 105%
-
Oils, sauces and condiments
-
Sweets and desserts
- Molasses 242 mg 65%
- Dark chocolate 228 mg 61%
- Halva 218 mg 58%
-
Drinks
- Espresso 80 mg 21%
- Flat white 31.7 mg 8%
-
Dishes
- Baba ganoush 83 mg 22%
- Falafel 82 mg 22%
- Peanut butter and jelly 64 mg 17%
-
Snacks, spices and more
- TVP (textured vegetable protein) · Dry 313 mg 83%
- Fish sauce 175 mg 47%
- Popcorn 144 mg 38%

How the list is made
Values per 100 g of the edible part, from the 17 Fit catalog; a family of foods (fresh, dried, cooked) is ranked by its richest form, named in the row. The percentage is of the EU reference intake for an adult, 375 mg a day (Regulation (EU) 1169/2011). “Source of” means at least 15% of it per 100 g and “high in” at least 30%; for drinks, half of that per 100 ml (Regulation (EC) 1924/2006).
17 Fit
Count calories without scales or tables
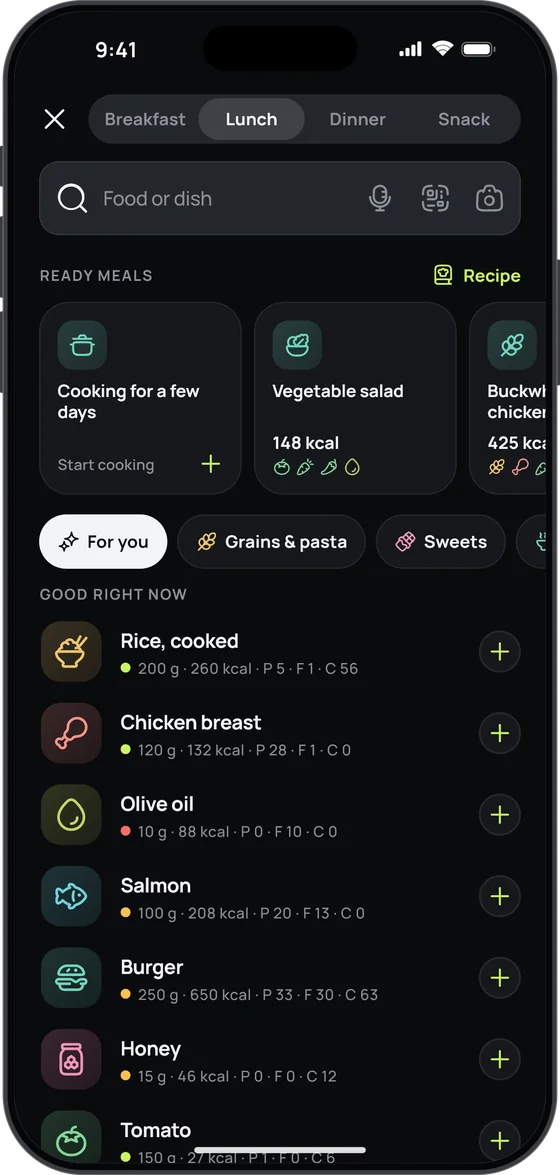
Snap your plate or just say what you ate — 17 Fit recognises the dishes, estimates the grams and counts the calories, macros, vitamins and minerals.
- Photo, voice or a search among 2,592 foods and dishes
- A plan that adjusts to your weight every week
- Free food diary, no sign-up and no ads