17 Fit Food calories Sweets and desserts
Gingerbread calories and nutrition facts
Gingerbread: 356 kcal per 100 g, protein 3.9 g, fat 16.4 g, carbs 49.2 g. 1 piece (40 g): 142 kcal.
Gingerbread here is the dark, moist cake made with ginger, cinnamon and molasses, baked in a pan and cut into squares, not the crisp cookies shaped into men and houses. A 40 g square comes to about 142 kcal. Whipped cream or a warm lemon sauce is the traditional topping.
- Source of fibre
- High in manganese
- Source of selenium
- Source of potassium
- Protein 4%
- Fat 41%
- Carbs 55%
In everyday portions
- 1 piece ≈ 40 g 142 kcal P 1.6 · F 6.6 · C 19.7 g
- Typical serving · 50 g 178 kcal P 1.9 · F 8.2 · C 24.6 g
- 100 kcal is 28 g this much of it gives 100 kcal
- Energy density Medium 3.6 kcal per gram: the lower it is, the more food you get for the same calories
Nutrition per 100 g
The percentage is the share of an adult’s daily reference intake set by the EU (Regulation 1169/2011). What the % means
Energy and macros
- Energy 356 kcal 1,490 kJ 18%
- Protein 3.9 g 8%
- Fat 16.4 g 23%
- Carbs available, without fibre 49.2 g 19%
- Fibre 3.3 g
- Salt 0.82 g 14%
Where the calories come from
- Protein 4%
- Fat 41%
- Carbs 55%
Protein and carbs give 4 kcal a gram, fat 9. “Other” is fibre, alcohol and organic acids.
Vitamins
- Vitamin A 14 µg 2%
- Vitamin D 0.1 µg 2%
- Vitamin E 2 mg 17%
- Vitamin K 1.2 µg 2%
- Vitamin C 0.1 mg <1%
- Vitamin B1 thiamin 0.079 mg 7%
- Vitamin B2 riboflavin 0.066 mg 5%
- Vitamin B3 niacin 0.55 mg 3%
- Vitamin B5 pantothenic acid 0.375 mg 6%
- Vitamin B6 0.19 mg 14%
- Folate B9 12 µg 6%
- Vitamin B12 0.06 µg 2%
- Choline no data
Minerals
- Potassium 439 mg 22%
- Calcium 71 mg 9%
- Phosphorus 54 mg 8%
- Magnesium 70 mg 19%
- Iron 0.8 mg 6%
- Zinc 0.39 mg 4%
- Copper 0.195 mg 20%
- Manganese 0.683 mg 34%
- Selenium 16.3 µg 30%
- Iodine 6 µg 4%
- Sodium 327 mg 14%
EU criteria for nutrition claims
Which of them 100 g of this food meets under Regulation (EC) 1924/2006.
- Source of fibre
- High in manganese
- Source of selenium
- Source of potassium
- Source of copper
- Source of magnesium
- Source of vitamin E
Sweets and desserts
Among sweets and desserts
The category in the 17 Fit catalog: 269 foods. Compared per 100 g.
- 81% More fibre than 81% of sweets and desserts.
- 84% More manganese than 84% of sweets and desserts.
- 94% More selenium than 94% of sweets and desserts.
- 94% More potassium than 94% of sweets and desserts.
- 90% More magnesium than 90% of sweets and desserts.
Similar in composition
The foods with the nearest calories and macros.
- Victoria sponge 354 kcal
- Blueberry muffins 375 kcal
- Cupcakes 352 kcal
- Gajar halwa 354 kcal
- Carrot cake 374 kcal
- Brigadeiros 364 kcal
More in Sweets and desserts
- Tortilla chips 497 kcal
- White chocolate 539 kcal
- Macarons 430 kcal
- Churros 419 kcal
- Baklava 440 kcal
- Pecan pie 443 kcal
17 Fit
Count calories without scales or tables
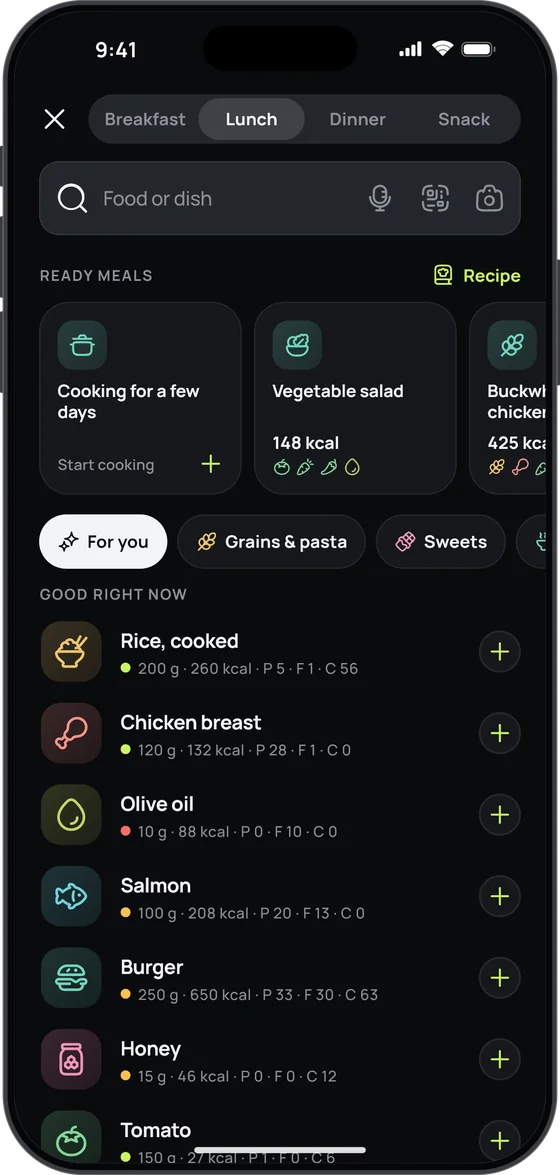
Snap your plate or just say what you ate — 17 Fit recognises the dishes, estimates the grams and counts the calories, macros, vitamins and minerals.
- Photo, voice or a search among 2,592 foods and dishes
- A plan that adjusts to your weight every week
- Free food diary, no sign-up and no ads


Where these numbers come from
USDA FoodData Central (SR Legacy, USA), code 172702.
The vitamins and minerals it lacked come from BLS (Germany).
Without what US law adds to flour, milk and juice: those vitamins and minerals are the food’s as made in Europe.
Carbs are available carbohydrates, without fibre, as on EU labels.